More Key Concepts and Terms: Unit 5
You’re becoming more comfortable with the key concepts and terms that you learned last time, but you realize that there are more to learn if you are going to be able to make an informed decision about the three woodlots. In particular, you realize that you need to be able to do the following. To increase your abilities in this area, consult your Woodlot Biodiversity field guide for the relevant information, and see the definitions of key terms given below as well as the links provided within the definitions.
Population Growth:
Population growth is defined as the change in the number of individuals during some period of time. This is calculated using demographic data; population growth rate = birth rate – death rate + immigration – emigration. The calculation of population size is expressed as Pt2 = Pt1 + (B) – (D) + (I) – (E), where Pt2 is the final population at the final time, Pt1 is the original or starting population size, B is the number of births, D is the number of deaths, I is the number of immigrants, and E is the number of emigrants.
Carrying capacity:
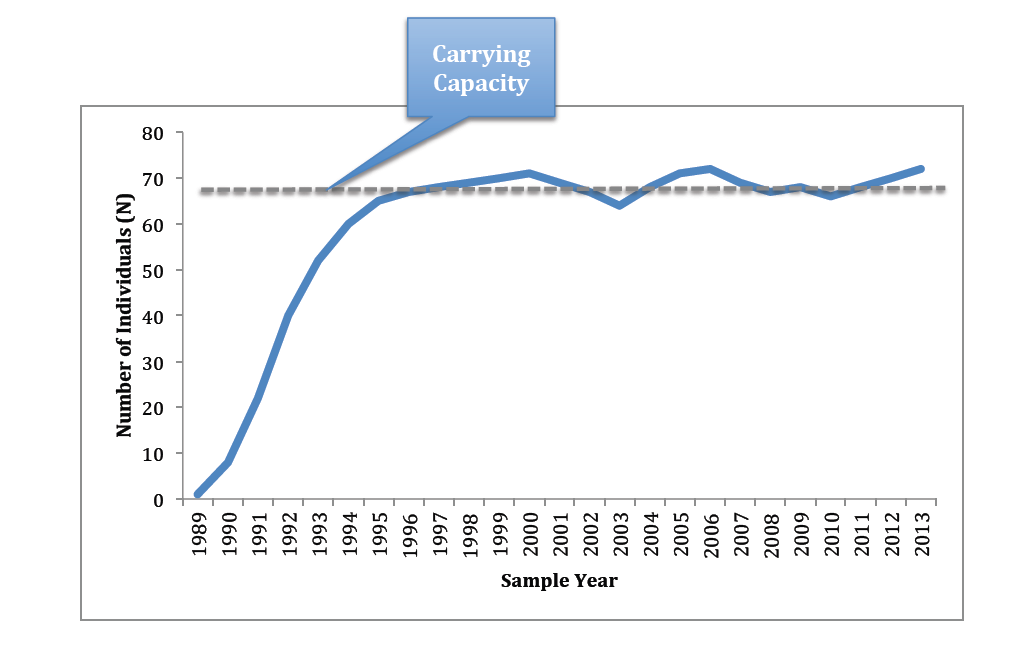
Carrying capacity is defined as the number of individuals that can be survive on the available resources within a given area. The carrying capacity for any landscape area is not fixed as it can be altered by disturbances that deplete resources. The depletion of resources is often accompanied by a decrease in population size. As the environment is degraded, carrying capacity actually shrinks, leaving the environment no longer able to support the original number of individuals in the population that may have been sustained for many years. No population can live beyond the environment’s carrying capacity for very long. The curve below represents a new population that is growing over time – eventually this population size reaches a maximum size that can be sustained by the resources (e.g., food) in this environment. This is shown by the dashed line labeled “CarryingCapacity”.
You’re becoming more comfortable with the key concepts and terms that you learned last time, but you realize that there are more to learn if you are going to be able to make an informed decision about the three woodlots. In particular, you realize that you need to be able to do the following. To increase your abilities in this area, consult your Woodlot Biodiversity field guide for the relevant information, and see the definitions of key terms given below as well as the links provided within the definitions.
- Demonstrate how the interactions among species may impact species diversity
- Evaluate population growth curves and examine carrying capacity.
- Identify ecosystem processes that influence populations.
- Discuss some of the processes that explain variation in diversity at spatial and temporal scales in a forest.
Population Growth:
Population growth is defined as the change in the number of individuals during some period of time. This is calculated using demographic data; population growth rate = birth rate – death rate + immigration – emigration. The calculation of population size is expressed as Pt2 = Pt1 + (B) – (D) + (I) – (E), where Pt2 is the final population at the final time, Pt1 is the original or starting population size, B is the number of births, D is the number of deaths, I is the number of immigrants, and E is the number of emigrants.
Carrying capacity:
Carrying capacity is defined as the number of individuals that can be survive on the available resources within a given area. The carrying capacity for any landscape area is not fixed as it can be altered by disturbances that deplete resources. The depletion of resources is often accompanied by a decrease in population size. As the environment is degraded, carrying capacity actually shrinks, leaving the environment no longer able to support the original number of individuals in the population that may have been sustained for many years. No population can live beyond the environment’s carrying capacity for very long. The curve below represents a new population that is growing over time – eventually this population size reaches a maximum size that can be sustained by the resources (e.g., food) in this environment. This is shown by the dashed line labeled “CarryingCapacity”.
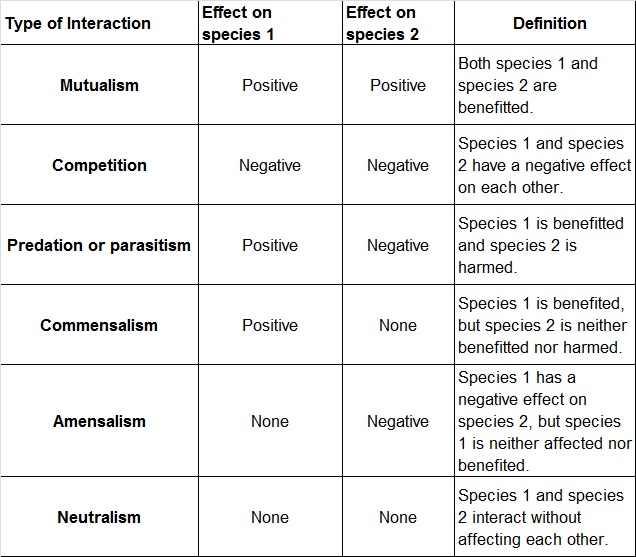
Species Interactions: Different species that live in the same ecosystem/community interact in many different ways (see table below). Note that some mutualisms may be either obligate (must live with it’s partner species) or facultative (can live without its partner species). Community structure includes the species and their abundances within a specific area and includes different types of interactions as in the table below.
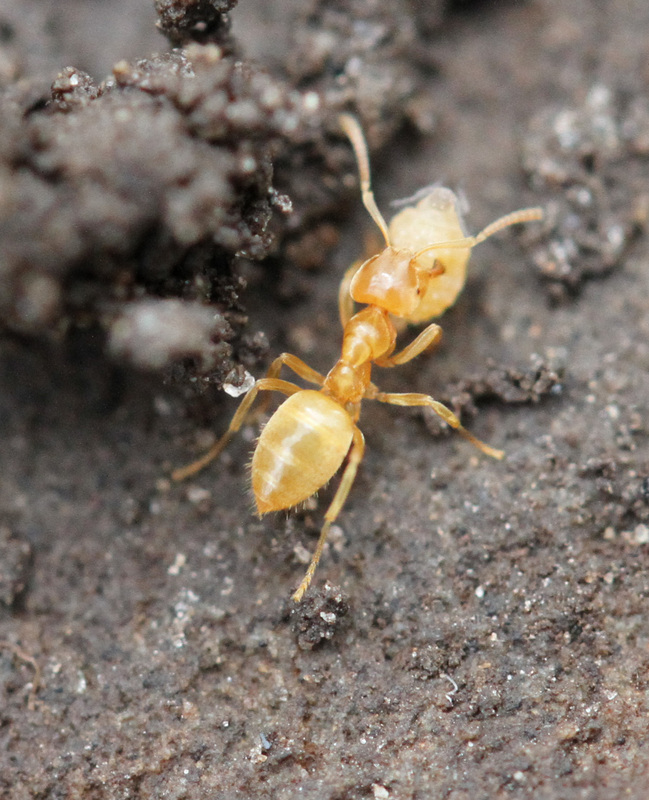
Species interactions: an example of ants, plants and aphids.
Ant species in the natural areas of campus are known to tend aphids (Hemiptera, or true bugs).
These aphids feed on the sap within phloem cells of plants. With a large infestation, this can negatively affect the plant.
Many aphid species are highly specific about which species of plant they feed upon. The sap the aphids eat is rich in sugars but low in nitrogen. In order to ingest enough nitrogen - they must pass much of this sap through their body.
This excess sap is an extremely useful resource for the ants. They consume the sap and use it to fuel further foraging for food.
A plant full of excess-sap producing aphids is a remarkable resource for a colony of ants - an the ants will defend those aphids from other ants and from potential predators (like a parasitoid wasp).
So, in this interaction, the plant is negatively affected by the aphid, the ants are positively affected by the aphid since they benefit from the energy and nutrition they gain from feeding on the excess sap that the aphids extrude while the aphid are positively affected by the ants since they receive the protection and reduced predation.
You can watch part of this remarkable story below on southern edge of the Dairy Bush where a burdock plant is covered in aphids which are tended by ants.
Ecosystem Processes:
Ecosystem processes include both the flow of energy and the cycling of materials. It all starts with the light energy that is captured by plants within the cellular process called photosynthesis. This results in the production of carbohydrates and other organic molecules that are later converted to heat energy through the process known as respiration. There must be a continuous source of solar energy because heat energy cannot be recycled. Elements (e.g., carbon, nitrogen, potassium and phosphorus) occur within ecosystems through a variety of process such as mineralization or the breaking down of parent materials (e.g., rock). Plants take up these elements from the soil, water or even directly from the air. Animals consume plants as a source of elements or may directly consume elements from the environment through water or consuming mineral soil. For example a moose in northern Ontario will frequently visit a “mineral lick” where it ingest minerals in the soil. Animals release minerals through excretion or decomposition (facilitated by bacteria and fungi). Elements are not lost from ecosystems, but rather continuously recycled. Forests, such as the woodlots in our case study are excellent systems to study ecosystem processes as are Grasslands.
Ecosystem processes include both the flow of energy and the cycling of materials. It all starts with the light energy that is captured by plants within the cellular process called photosynthesis. This results in the production of carbohydrates and other organic molecules that are later converted to heat energy through the process known as respiration. There must be a continuous source of solar energy because heat energy cannot be recycled. Elements (e.g., carbon, nitrogen, potassium and phosphorus) occur within ecosystems through a variety of process such as mineralization or the breaking down of parent materials (e.g., rock). Plants take up these elements from the soil, water or even directly from the air. Animals consume plants as a source of elements or may directly consume elements from the environment through water or consuming mineral soil. For example a moose in northern Ontario will frequently visit a “mineral lick” where it ingest minerals in the soil. Animals release minerals through excretion or decomposition (facilitated by bacteria and fungi). Elements are not lost from ecosystems, but rather continuously recycled. Forests, such as the woodlots in our case study are excellent systems to study ecosystem processes as are Grasslands.
